You’ve almost certainly tested your website at Google’s PageSpeed Insights – Google Developers more than once.
Most of the time, the outcome is discouraging.
There are a lot of posts on Facebook groups about this topic that say, “Please help – my PageSpeed scores are bad.” or “How can I improve my Google Page Speed score?”
One or more Facebook readers may have seen my comments. Mostly along the lines of “just ignore it” or something similar.
Can you simply disregard these Google results?
Few can because this topic is judged far too important, despite the fact that it has no direct impact on the majority of websites.
This is most likely the same as having an SEO web developer sell you meta tag keywords for your website. (Since 2009 it has been very clear: “Google does not use the keywords meta tag in web ranking” – https://developers.google.com/search/blog/2009/09/google-does-not-use-keywords-meta-tag)
It’s not much different with Google’s PageSpeed Insights / Lighthouse.
Take a look at what Google says:
Performance score
Google PageSpeed Insights provides a score at the top of the report that summarizes the page’s performance. This score is calculated by launching Lighthouse and collecting and analyzing lab data about the page. A score of 90 or higher is considered excellent. A score of 50 to 90 indicates that there is room for improvement, and a score of less than 50 is considered poor.
Lab data
Google PageSpeed Insights analyzes the given URL with Lighthouse, generating a performance score that estimates the page’s performance on various metrics such as: First Contentful Paint, Largest Contentful Paint, Speed Index, Cumulative Layout Shift, Time to Interactive, and Total Blocking Time.
• Good is denoted by a green check mark
• Needs Improvement is denoted by an orange informational circle
• Poor is denoted by a red warning triangle
What constitutes a good lab data score? – https://developers.google.com/speed/docs/insights/v5/about?hl=en-US#lab
Any green score (90+) is considered good.
Any reading you’ve done up to this point may have led you to the conclusion that having a 90+ score is critical.
This is where the issue arises.
Let us dig deeper into this subject: https://developers.google.com/web/fundamentals/performance/speed-tools#understanding_lab_vs_field_data
Lab data is performance data collected within a controlled environment with predefined device and network settings. This offers reproducible results and debugging capabilities to help identify, isolate, and fix performance issues.
Strengths
• Helpful for debugging performance issues
• End-to-end and deep visibility into the UX
• Reproducible testing and debugging environment
Limitations
• Might not capture real-world bottlenecks
• Cannot correlate against real-world page KPIs
https://developers.google.com/search/blog/2021/04/more-details-page-experience?hl=en
Q: Where does the Core Web Vitals data that Search considers come from?
A: The data comes from the Chrome User Experience Report, which is based on actual user visits and interactions with web pages (also known as field data). To be clear, the data is not computed based on lab simulations of loading pages or based on the visits of a non-human visitor like Googlebot.
Q: How is a score calculated for a URL that was recently published, and hasn’t yet generated 28 days of data?
A: Similar to how Search Console reports page experience data, we can employ techniques like grouping pages that are similar and compute scores based on that aggregation. This is applicable to pages that receive little to no traffic, so small sites without field data don’t need to be worried.
So on and so forth.
Bottom line: For ranking, Google ONLY uses Real World Data, also known as field data, and NOT any lab data.
Furthermore, Google states: However, hundreds of other signals, including the other Core Web Vitals, may result in a different ranking…
So, what should you do? Collect field data from your website to gain an understanding of any of the signals used by Google for the PageSpeed Insights report, or test the website with real users in real networks to see how it performs.
How this look in real world:
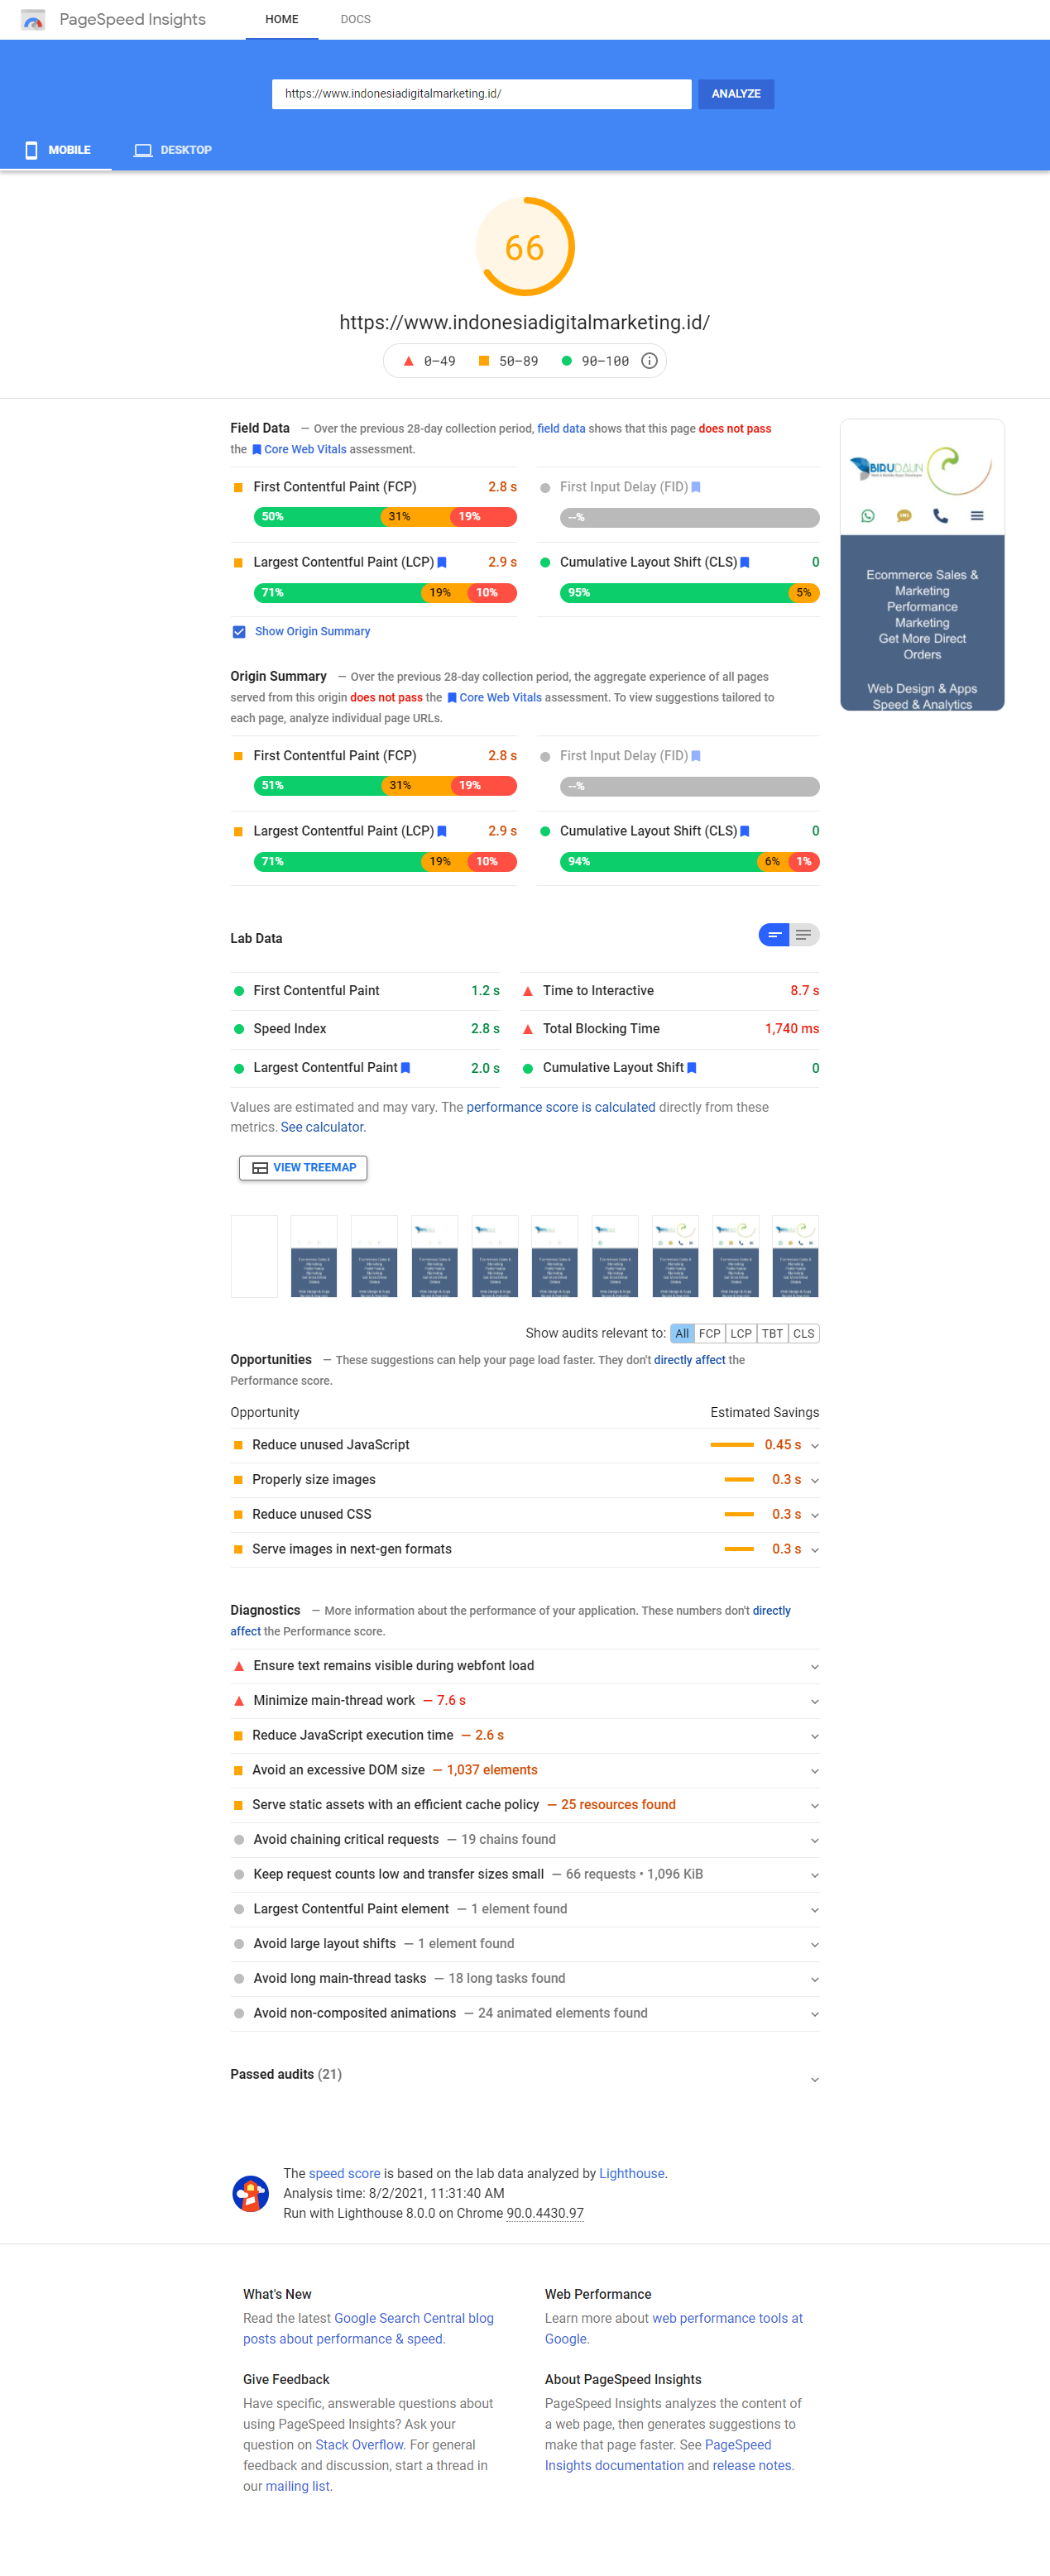
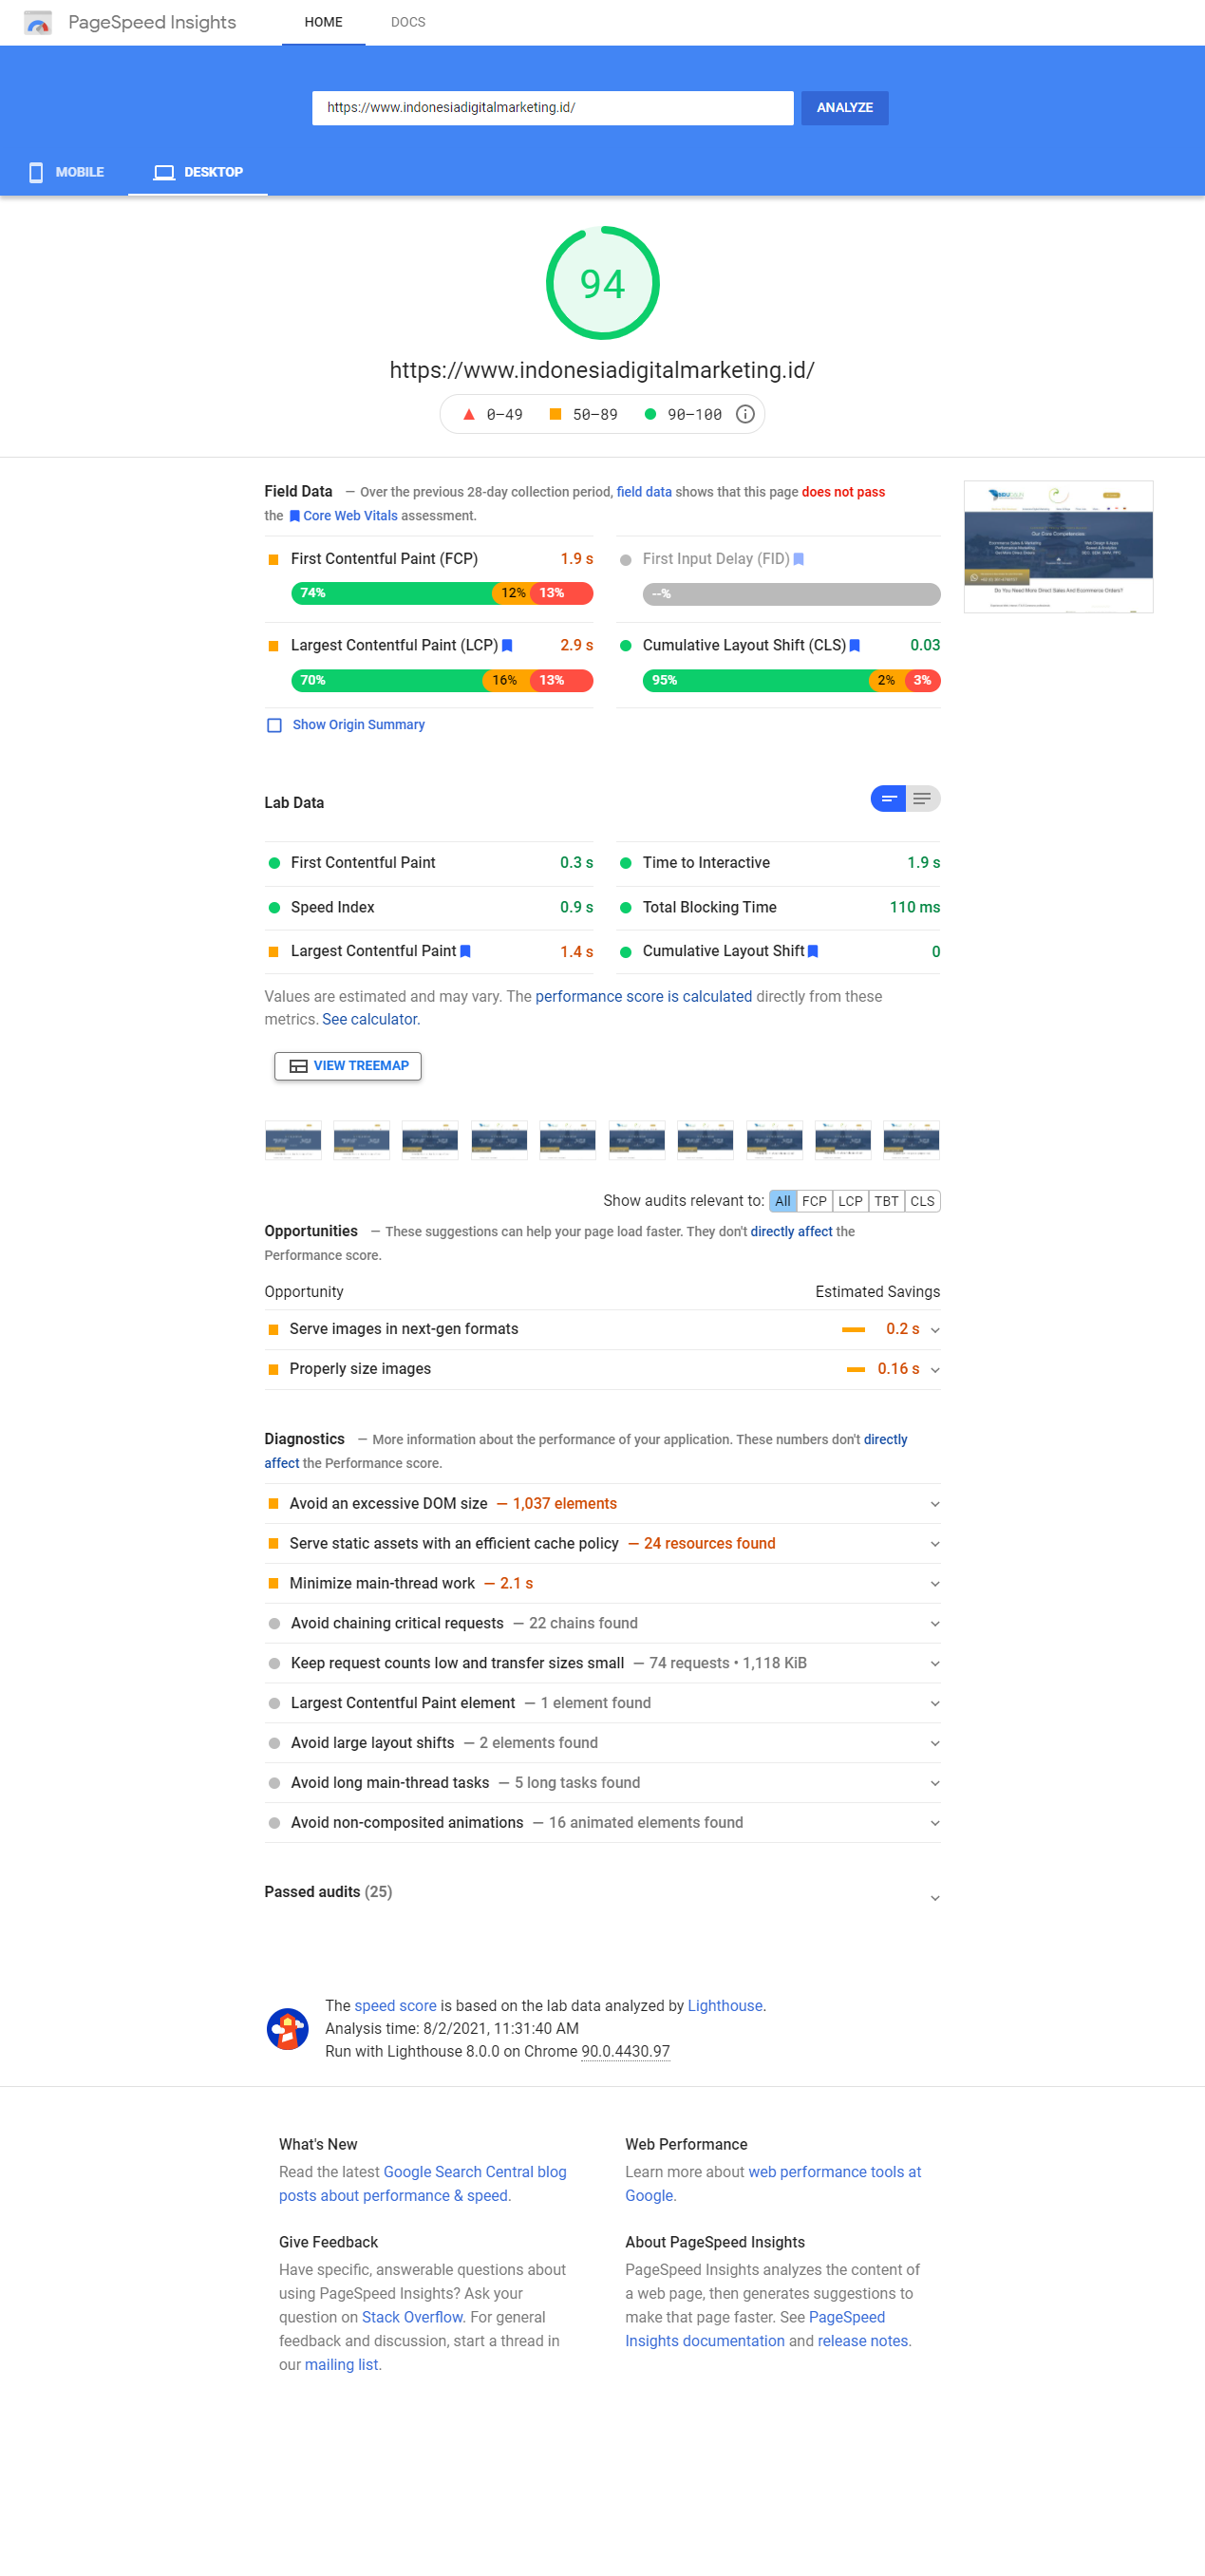
The 1st example: A multilingual WordPress website, optimized for Google PageSpeed Insights lab data, with multiple plugins. The lab and field data are OK.
Learning curve: Why are the field data only OK when the website is optimized for lab data? Actually, the field data should be much better. Why is this not the case?
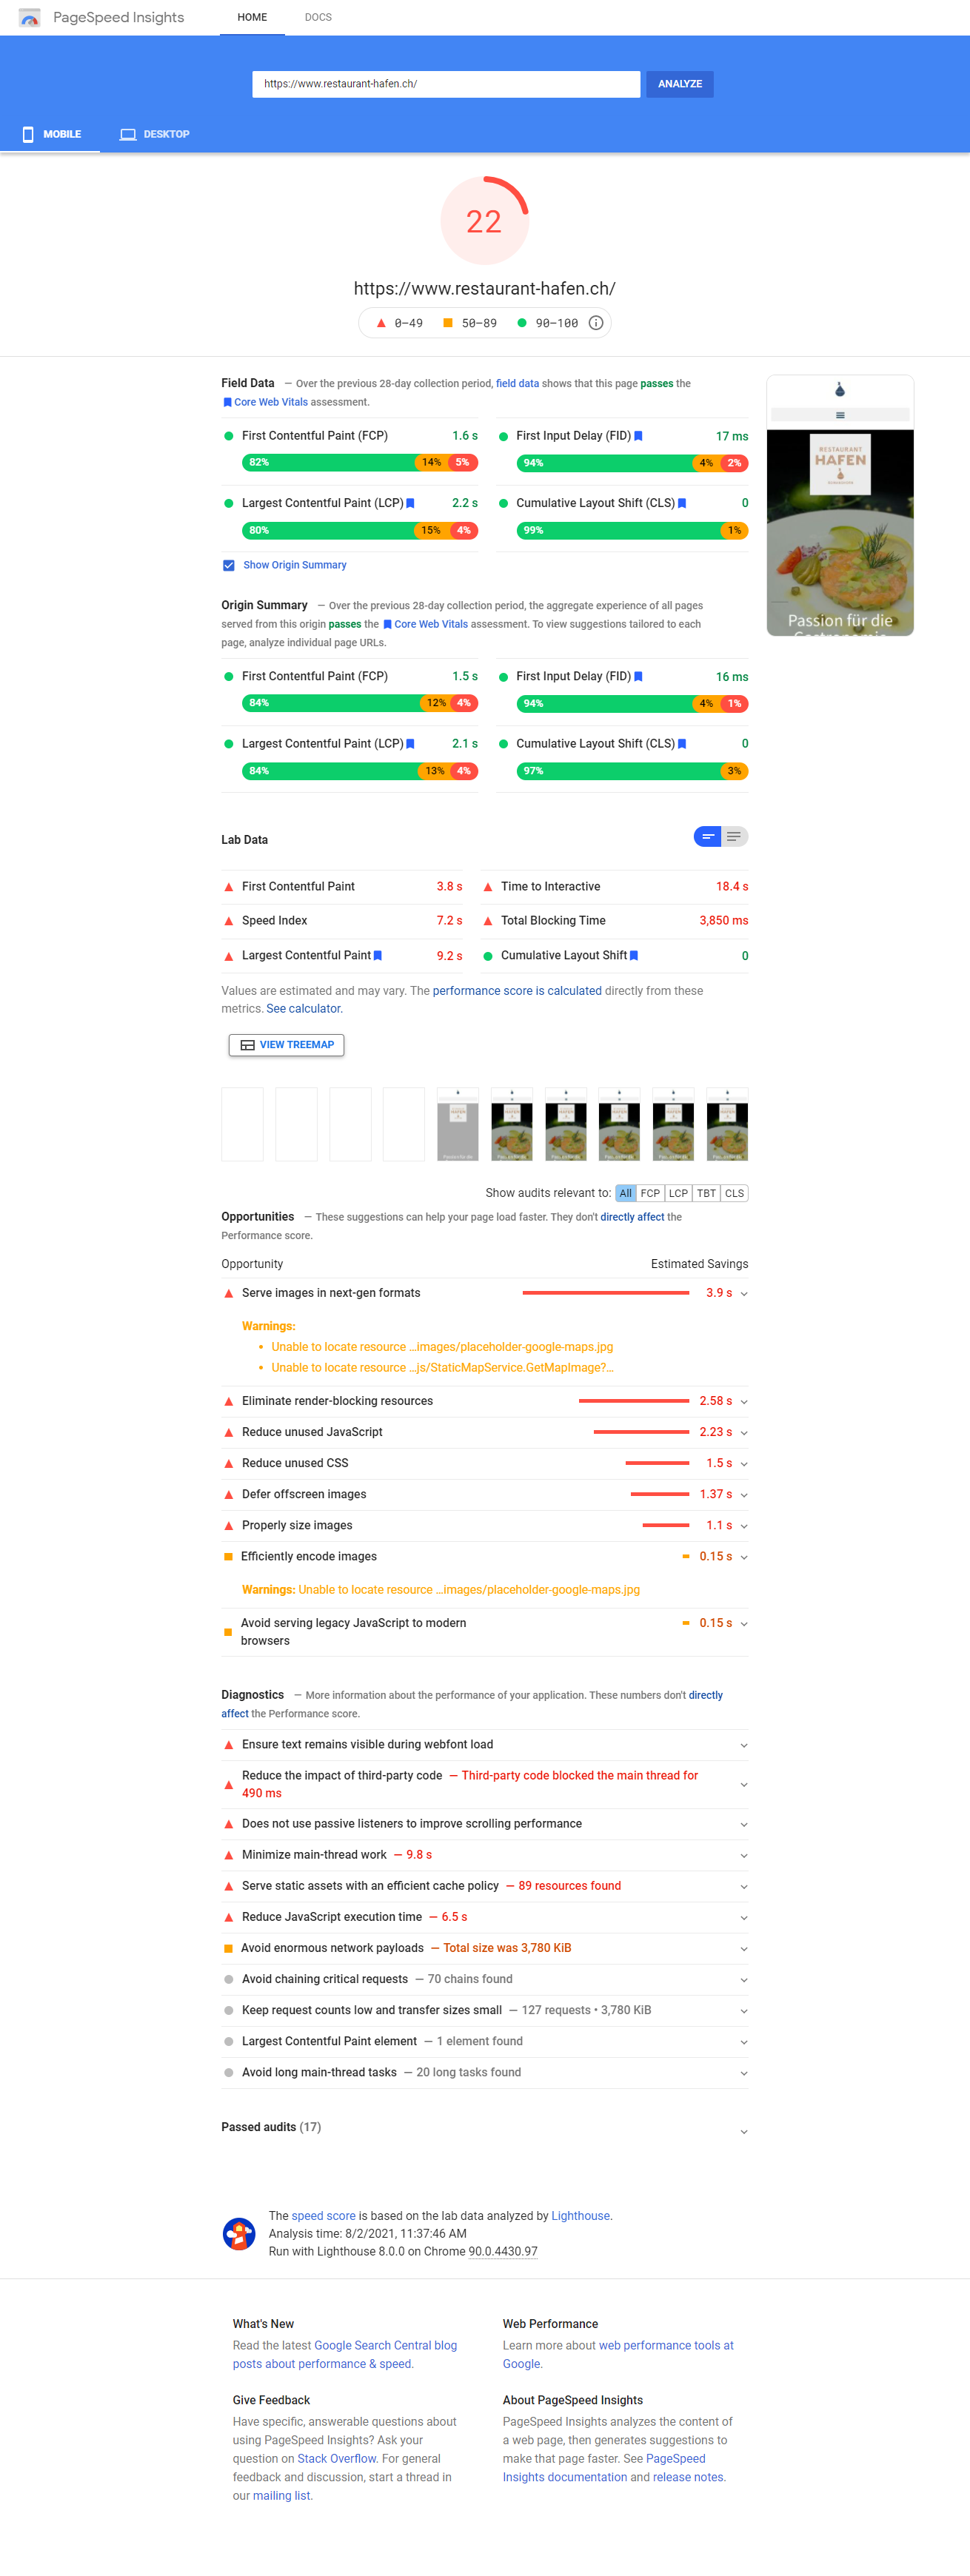
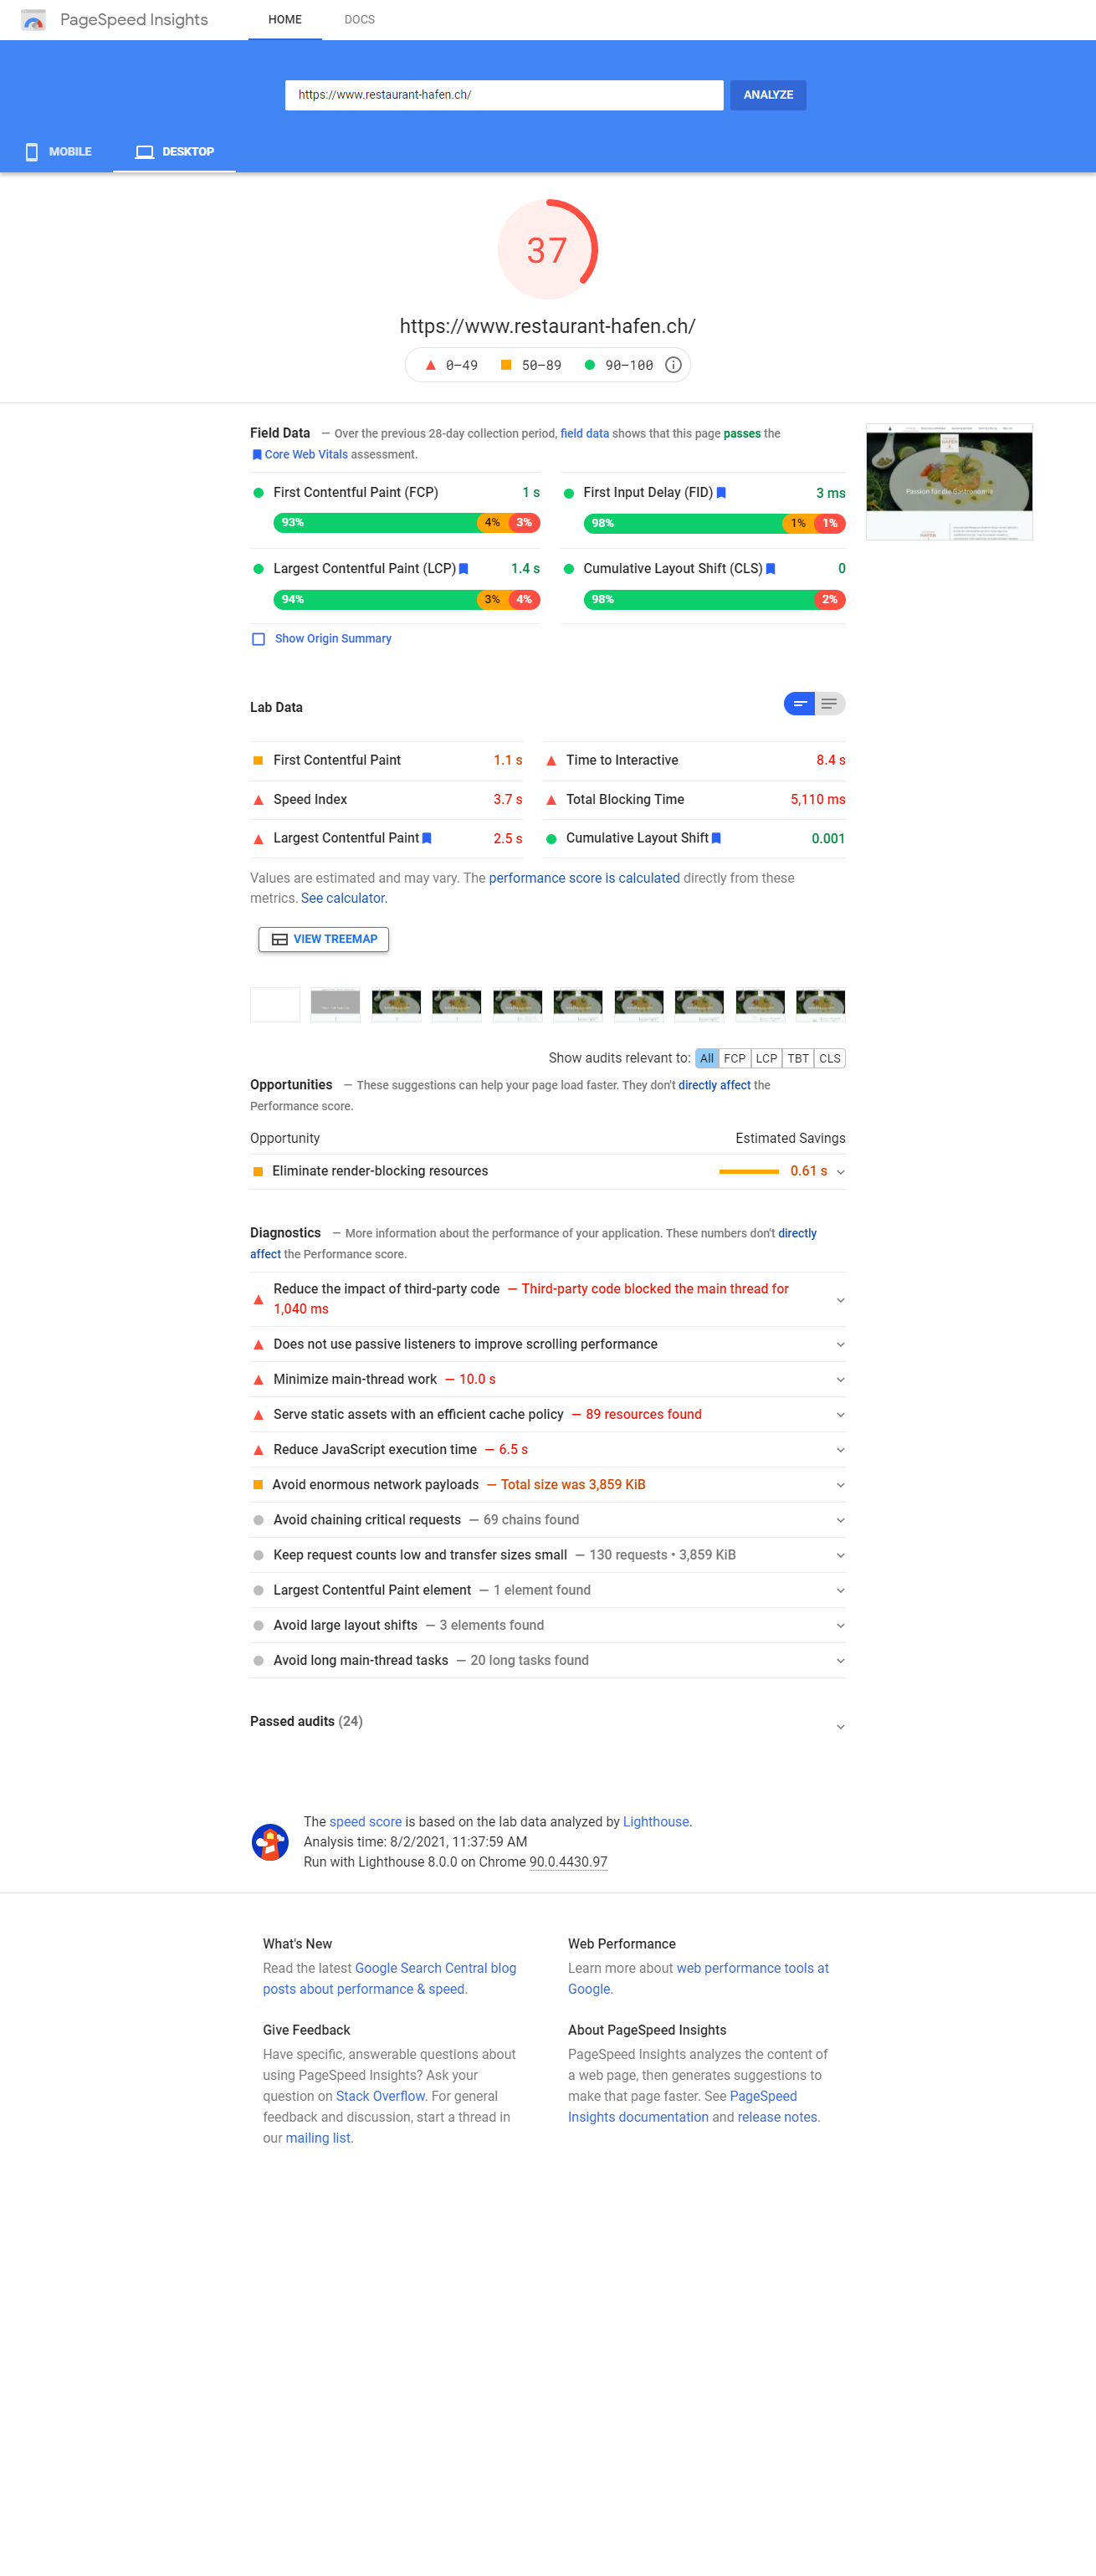
The 2nd example: A website, not lab, but field data optimized, with a single language, multiple plugins, WordPress. The PageSpeed Insights field data are very good.
Learning curve: Why do these very good field data contrast with very low lab data? Which scores are the really important ones again?
What we learn from this 2 examples?
- Lab and field data can be on the opposite end of the scale.
- Good lab data do not ensure good field data.
The question now is why are the lab and field data always further apart?
(Another question derived from this: Can I buy good Google PageSpeed Insights field data? Yes, you can. But this is not today’s topics)
Back to the answer, to this very specific subject, which is somehow obscured between hundreds of thousands of links to and from Google PageSpeed Insights. I know Google knows as well. So it didn’t happen by chance, as some people might assume.
But to keep it simple: Yes, you can ignore all lab data and focus only on real-world / field data aka RUM data.
And if your field data are good or very good, as the above examples show, then there is nothing for you to do. Everything is good. Except for the lab scores that are displayed.
And if your site has no field data at all, that’s also good for now.
Any question? Please let me know.
Best,
Pak Kriss


